
From the rolling mountains in the East to the fertile delta in the West, Tennessee contributes to the feeding of the world. Soybean fields give way to cattle-dotted pastures, chicken barns and tobacco rows fill landscapes. This is a state of crop tenders and animal raisers–Tennessee’s agricultural producers. UT System researchers and Extension agents walk with them every step along the way.
Tennessee Agriculture Infographic
Stats from 2019 U.S. Department of Agriculture
Designed by Halley Kurtz
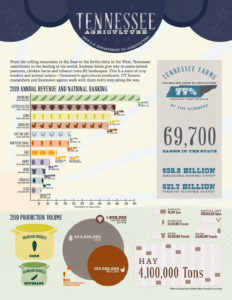
Tennessee Farms
10.8 Million acres of agriculture covering 77% of the state
69,700 farms in the state
$56.3 Billion agricultural economic output*
$21.7 Billion forestry economic output*
* When including their multiplier effects through the economy
2019 Annual Revenue And National Ranking
$624,000,000
17th in the U.S.
$487,700,000
11th in the U.S.
$459,300,000
18th in the U.S.
$457,700,000
16th in the U.S.
$236,100,00
8th in the U.S.
$227,200,00
21st in the U.S.
$153,000,000
12th in the U.S. for Hay
31st in the U.S. for Alfalfa
$105,900,000
31st in the U.S.
$88,800,000
20th in the U.S.
$85,200,00
4th in the U.S.
$59,000,000
30th in the U.S.
2019 Production Volume

161,100,00
Bushels of Corn

64,400,000
Bushels of Soybeans

1,800,000
Calves and cattle

344,600,000
Eggs

177,700,000
Broilers

521
Horticultural Operations

48,000 tons
Alfalfa

30,500,000 pounds
Tobacco

160,400,000 pounds
Hogs

960,000,000 bales
Cotton Lint

551,000,000 pounds
Dairy
4,100,000 tons
Hay